
Preview
Transitioning from a legacy monolithic architecture to a modern, distributed cloud platform is not just a technical challenge; it is a fundamental evolution in deployment philosophy.
In this article, I detail the journey of architecting a high-availability infrastructure on AWS EKS, moving from a single weekly release to multiple automated daily deployments.
Central to this transformation was the implementation of a dual-mirror cluster codenamed Asterix & Obelix, managed entirely via Infrastructure as Code and GitOps.
We will dive into how the integration of Traefik HA Ingress Controllers, AWS Load Balancers, and risk-free DNS cutovers ensured zero-downtime operations while providing dynamic, containerized testing environments for stakeholders across international branches.
Overview
As the diagram shows, the platform is built around high availability. Two mirrored AWS EKS clusters, codenamed Asterix and Obelix, operate in an active/passive model: only one cluster serves production traffic at any given time, while the other remains ready to take over.
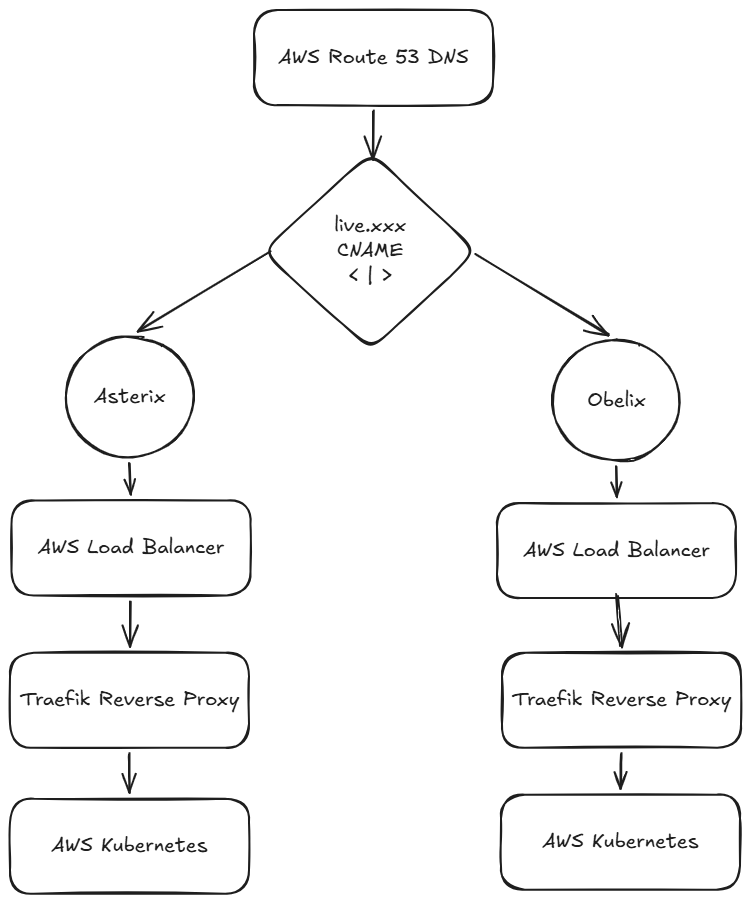
The central control point is live.xxx. It is a CNAME that is switched manually, through a small CLI tool using AWS APIs, to either asterix.xxx or obelix.xxx, depending on which cluster is active. Every application domain is also a CNAME of live.xxx, making it possible to move the entire production entry point through a single, controlled change. A deliberately low TTL keeps this cutover quick and predictable.
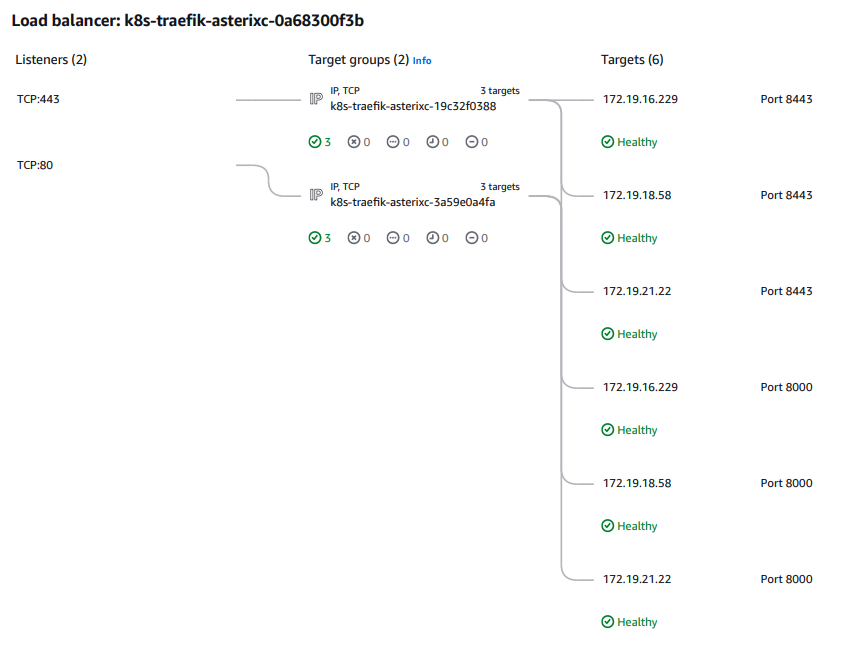
Behind each cluster endpoint, AWS load balancers direct traffic to redundant Traefik instances. Traefik acts as the reverse-proxy layer, where the application domains, routing rules, and TLS certificates are configured. From there, requests reach the services running in the relevant EKS cluster.
The two clusters share an external Aurora RDS PostgreSQL database and use compatible JWT sessions, so the switch is transparent to users. Redis caches and queues stay isolated per cluster to avoid cross-cluster interference: after a cutover, the previous cluster can finish its in-flight jobs while the newly active one accepts new work. The platform is available to the company’s international branches through site-to-site VPN connectivity into the AWS VPC, managed by the systems administration team.
Architecture at a glance
Both Asterix and Obelix are private AWS EKS clusters running in the same VPC. The VPC spans three Availability Zones, giving each cluster a multi-AZ foundation while keeping the platform inside the company network perimeter. The clusters are intentionally mirrored: the same platform can be prepared, validated, and promoted without having to change the application entry points.

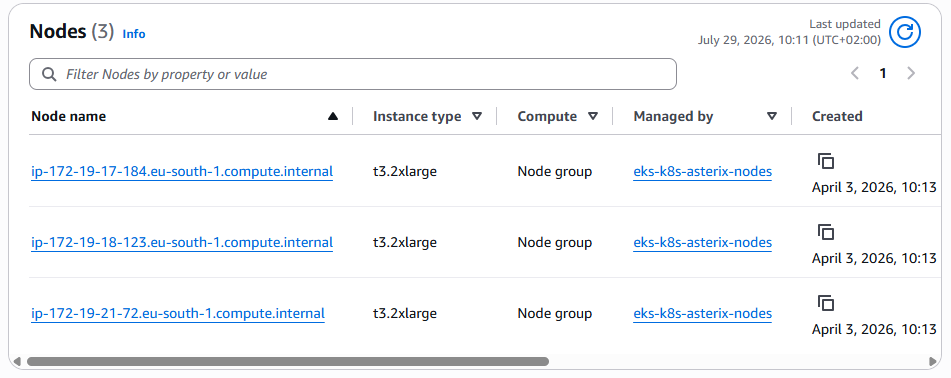
The clusters and their node groups are provisioned with Terraform. Each cluster starts with three nodes and can scale to nine as capacity changes. Kubernetes handles horizontal scaling for workloads, while an AWS plugin scales the underlying nodes. This keeps compute capacity aligned with demand without requiring fixed, oversized worker pools.
All ingress remains private. AWS load balancers forward requests from the corporate network to the redundant Traefik layer inside the active cluster; Traefik then routes them to the relevant services. The DNS switching strategy described earlier chooses which cluster receives production traffic, while this layer provides the private path into that cluster.
Developers can also target a specific cluster through its direct URL, such as asterix.xxx or obelix.xxx. This makes it possible to run the full set of production-facing checks against the candidate cluster before moving live.xxx, keeping validation separate from the public production entry point.
Repository structure
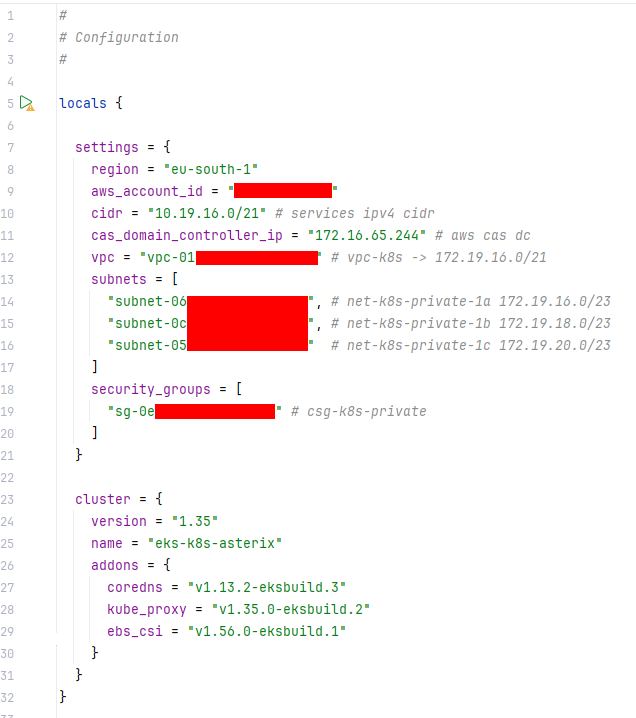
The platform is managed from a single Git repository that brings together the Terraform infrastructure and the Kubernetes deployment definitions. For each cluster, Terraform is deliberately split into two separate apply phases. The cluster/ directory bootstraps the foundation: provider setup, configuration, the EKS cluster, and its node groups. Once that foundation exists, utilities/ can be applied to add the platform services that depend on it.
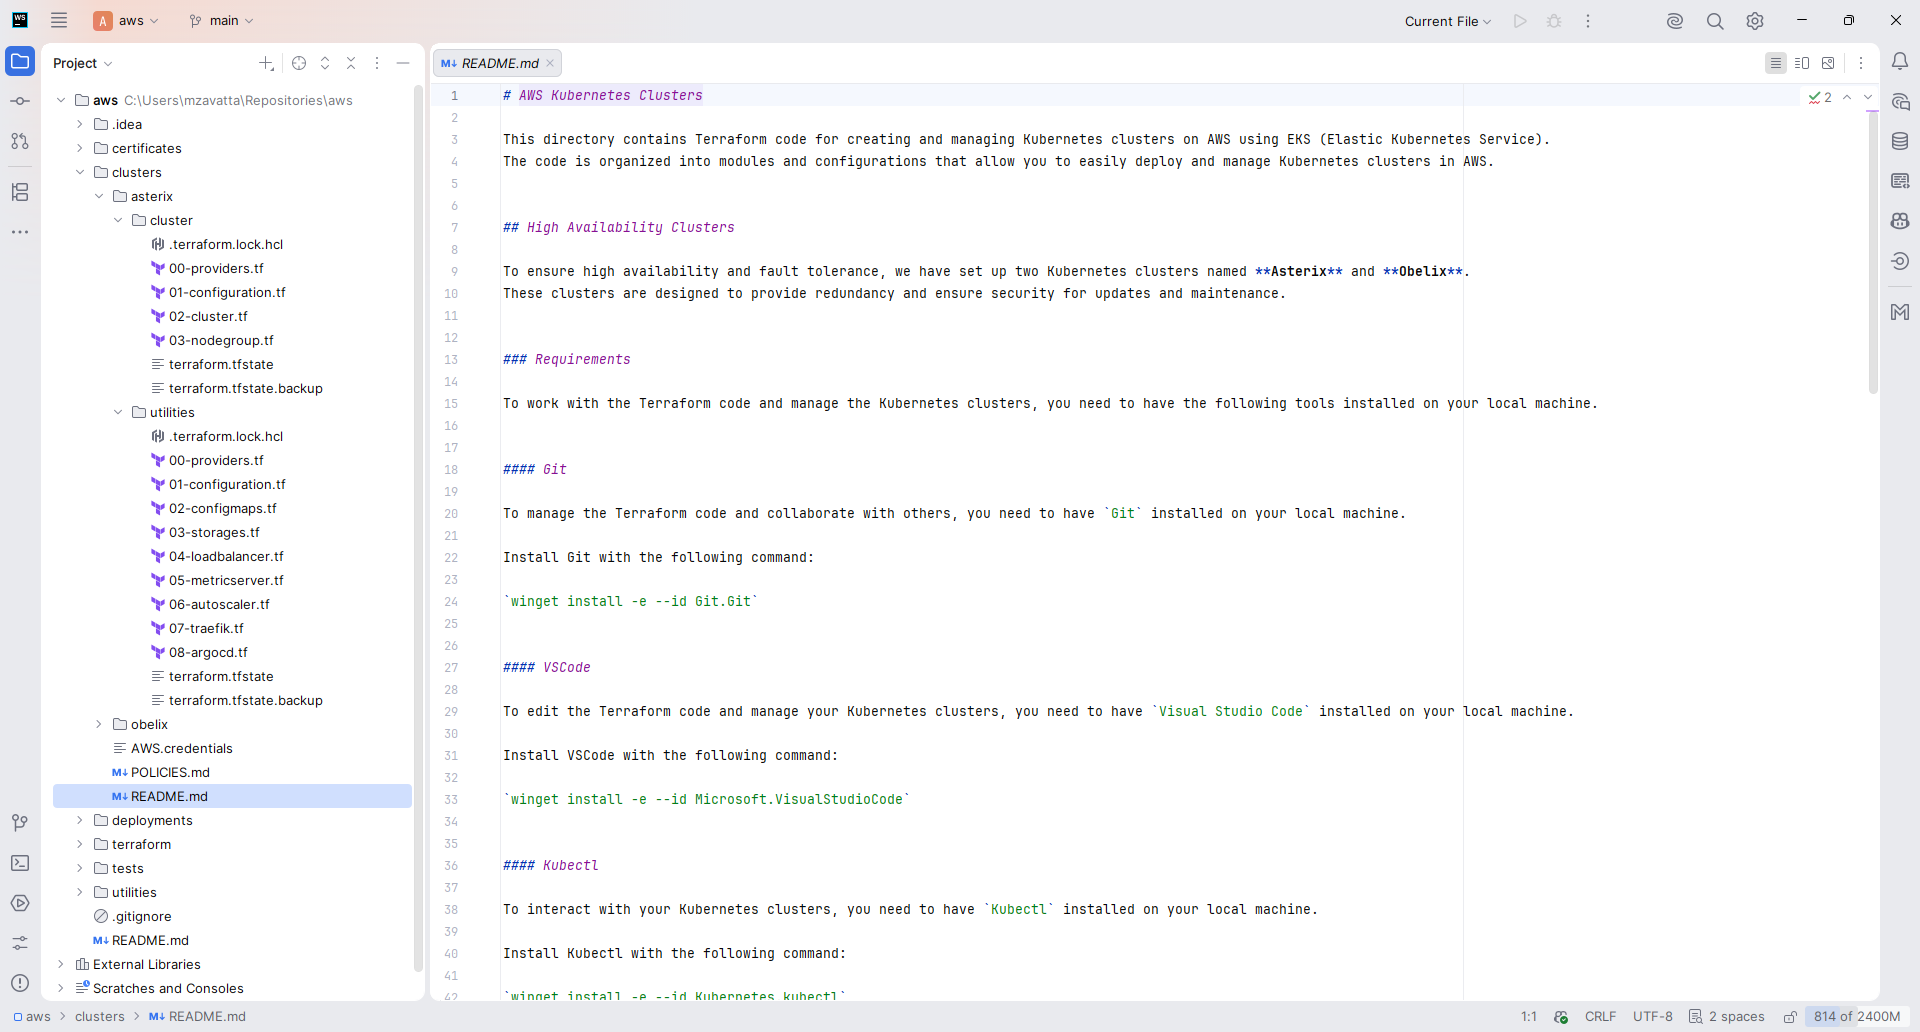
The utilities phase keeps the supporting components in explicit, readable steps: ConfigMaps, Storage, the Load Balancer integration, Metrics Server, Node Autoscaling, Traefik, and Argo CD. Cluster-specific values are centralized in the configuration layer, including the AWS region, VPC, subnets, security groups, EKS version, and cluster name. The remaining Terraform files consume these parameters instead of duplicating environment-specific values.
The same repository also contains the application deployment definitions. The deployments/_index directory holds the Argo CD Application resources that register each application, while the adjacent directories contain the Kubernetes manifests for their respective services.
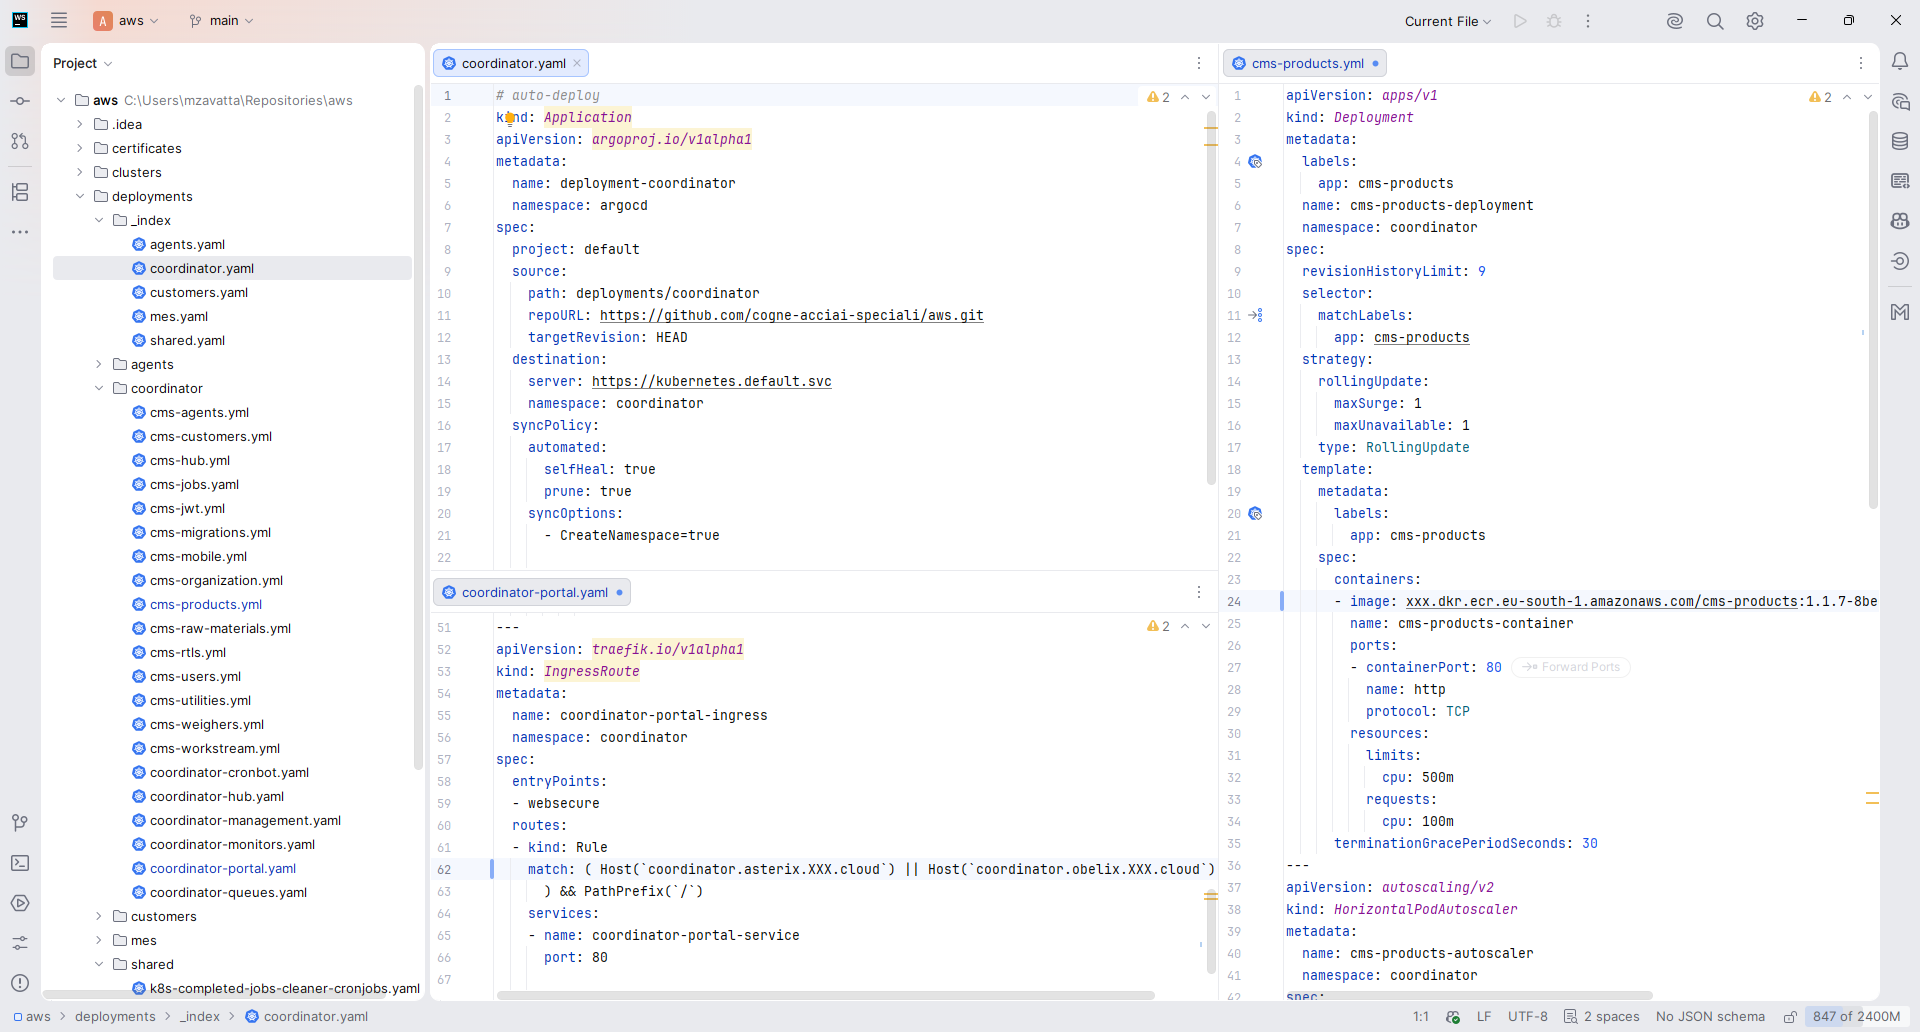
Application pipelines publish images to ECR and update the corresponding image tag in these manifests, keeping the desired runtime version under version control.
GitOps delivery flow
The delivery process follows a trunk-based development model: developers commit and merge regularly into main, using feature flags whenever a feature needs to be separated from its release. Every change starts with a pull request and a review, but production is not the first place where it is validated.
Developer testing and user acceptance testing run in dedicated environments outside the production clusters. UAT environments are created on demand through CLI tools, scripts, Docker Compose, and Makefile targets. An orchestration repository combines the relevant repositories at the branches under review, then starts an isolated environment with the seed data needed for user validation. Once the UAT is complete, the same tooling tears it down; the production pull request can then be approved and merged.
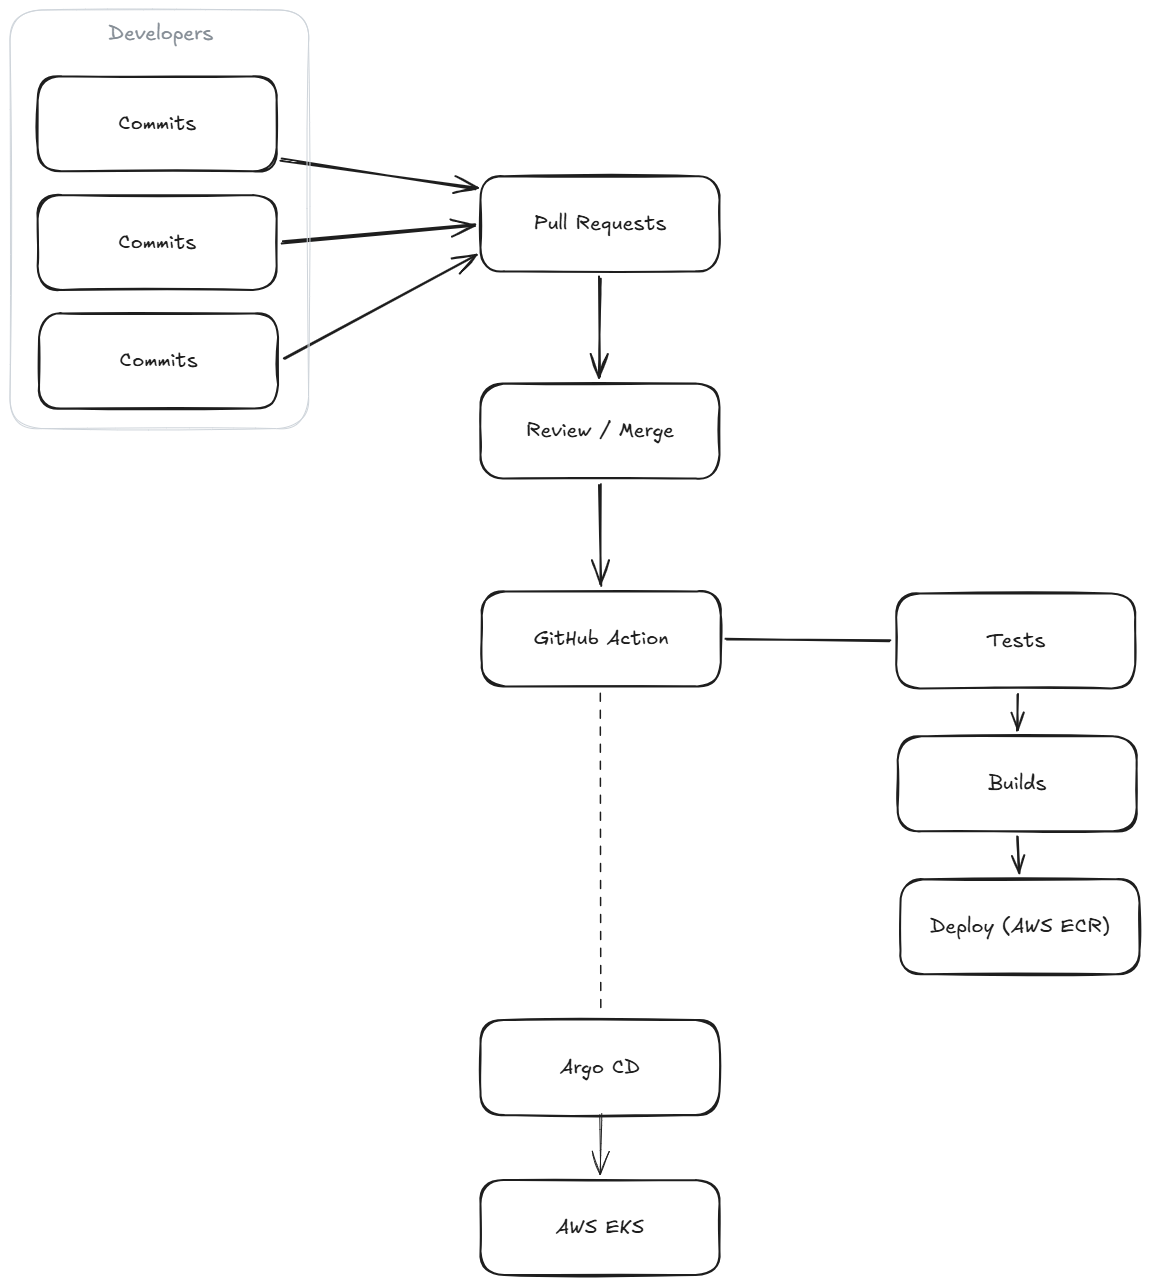
A merge to main triggers a GitHub Actions workflow. It runs the automated tests, builds the Docker image, and publishes it to ECR. Only after those stages succeed does the workflow update the image tag in the GitOps repository. A failure at any point stops the process before the desired production state is changed.
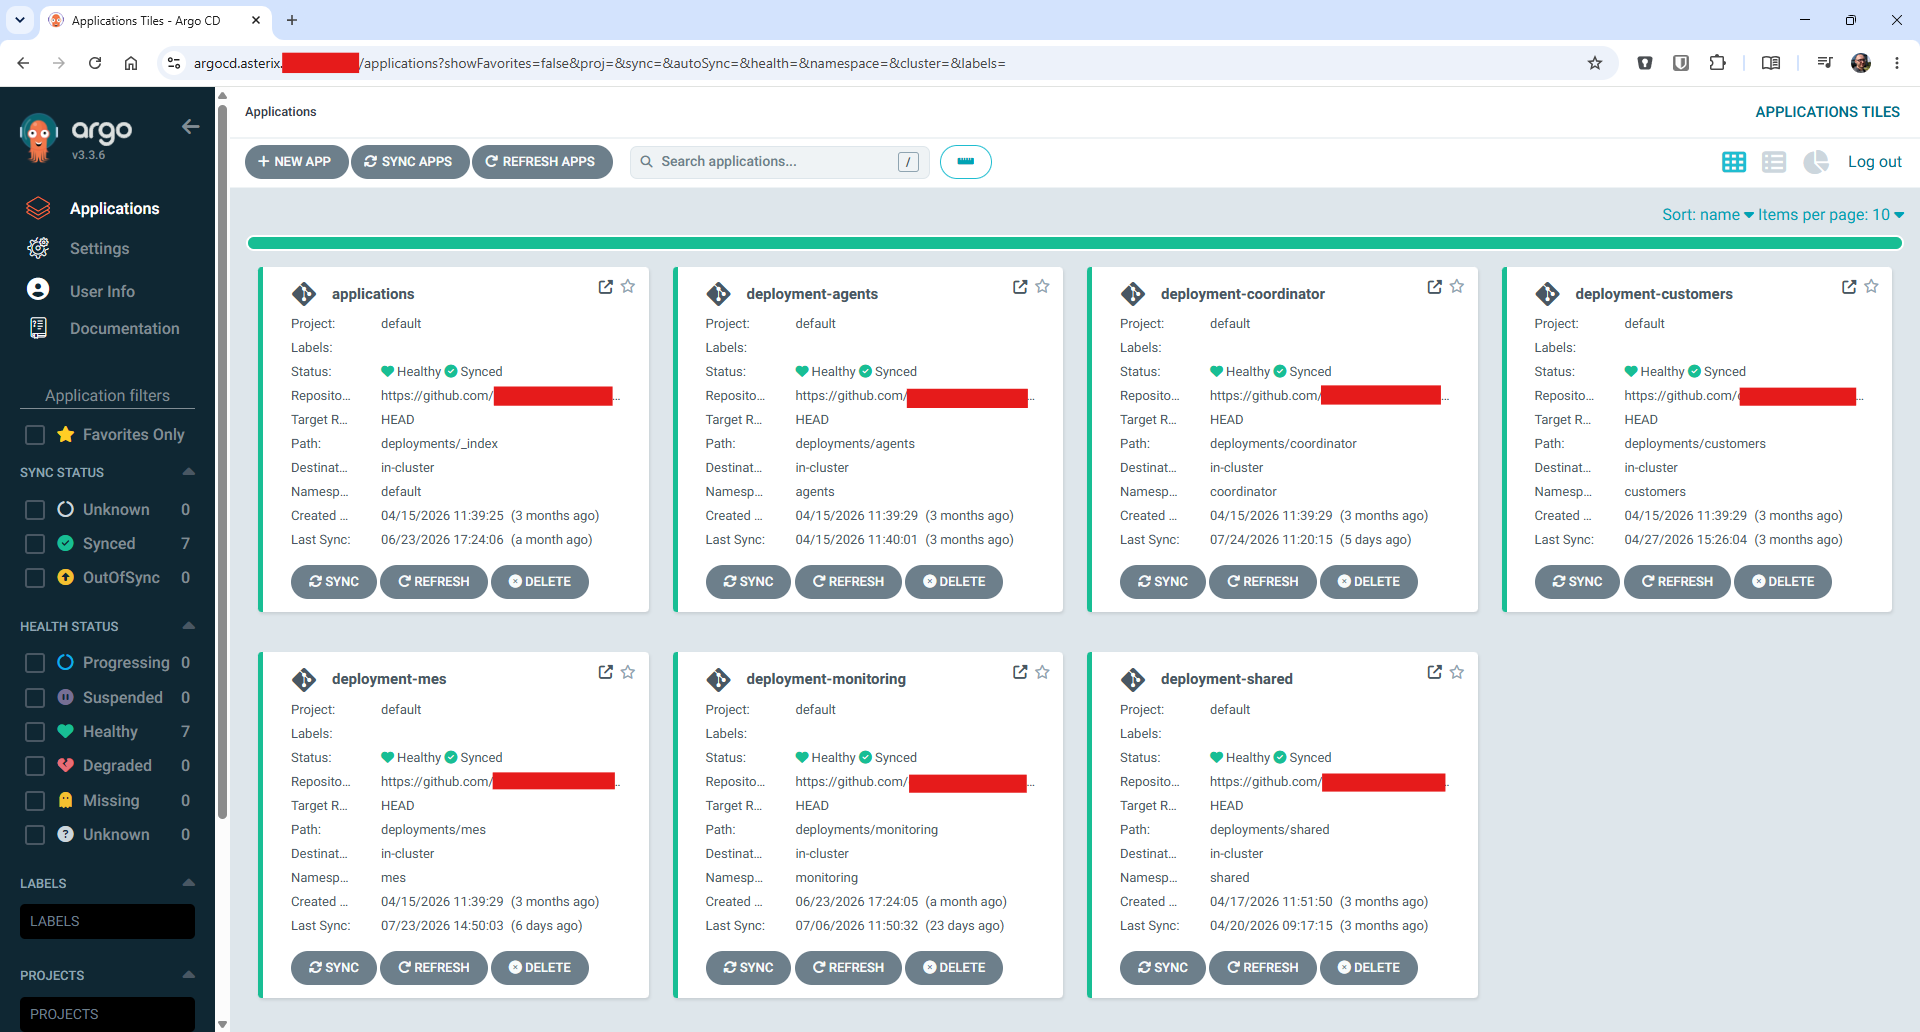
Both Argo CD instances watch that shared desired state and automatically reconcile the resulting version on Asterix and Obelix. This keeps the two production clusters aligned for application releases, while still allowing the DNS cutover strategy to be used independently for platform operations. The Applications view provides a concise overview of the services and their sync and health status.
At the application level, Argo CD exposes the relationship between the declarative manifests and the resources running in the cluster. This makes it possible to inspect deployments, ReplicaSets, ConfigMaps, Services, and IngressRoutes from the same view, together with the sync history and current health of the release.
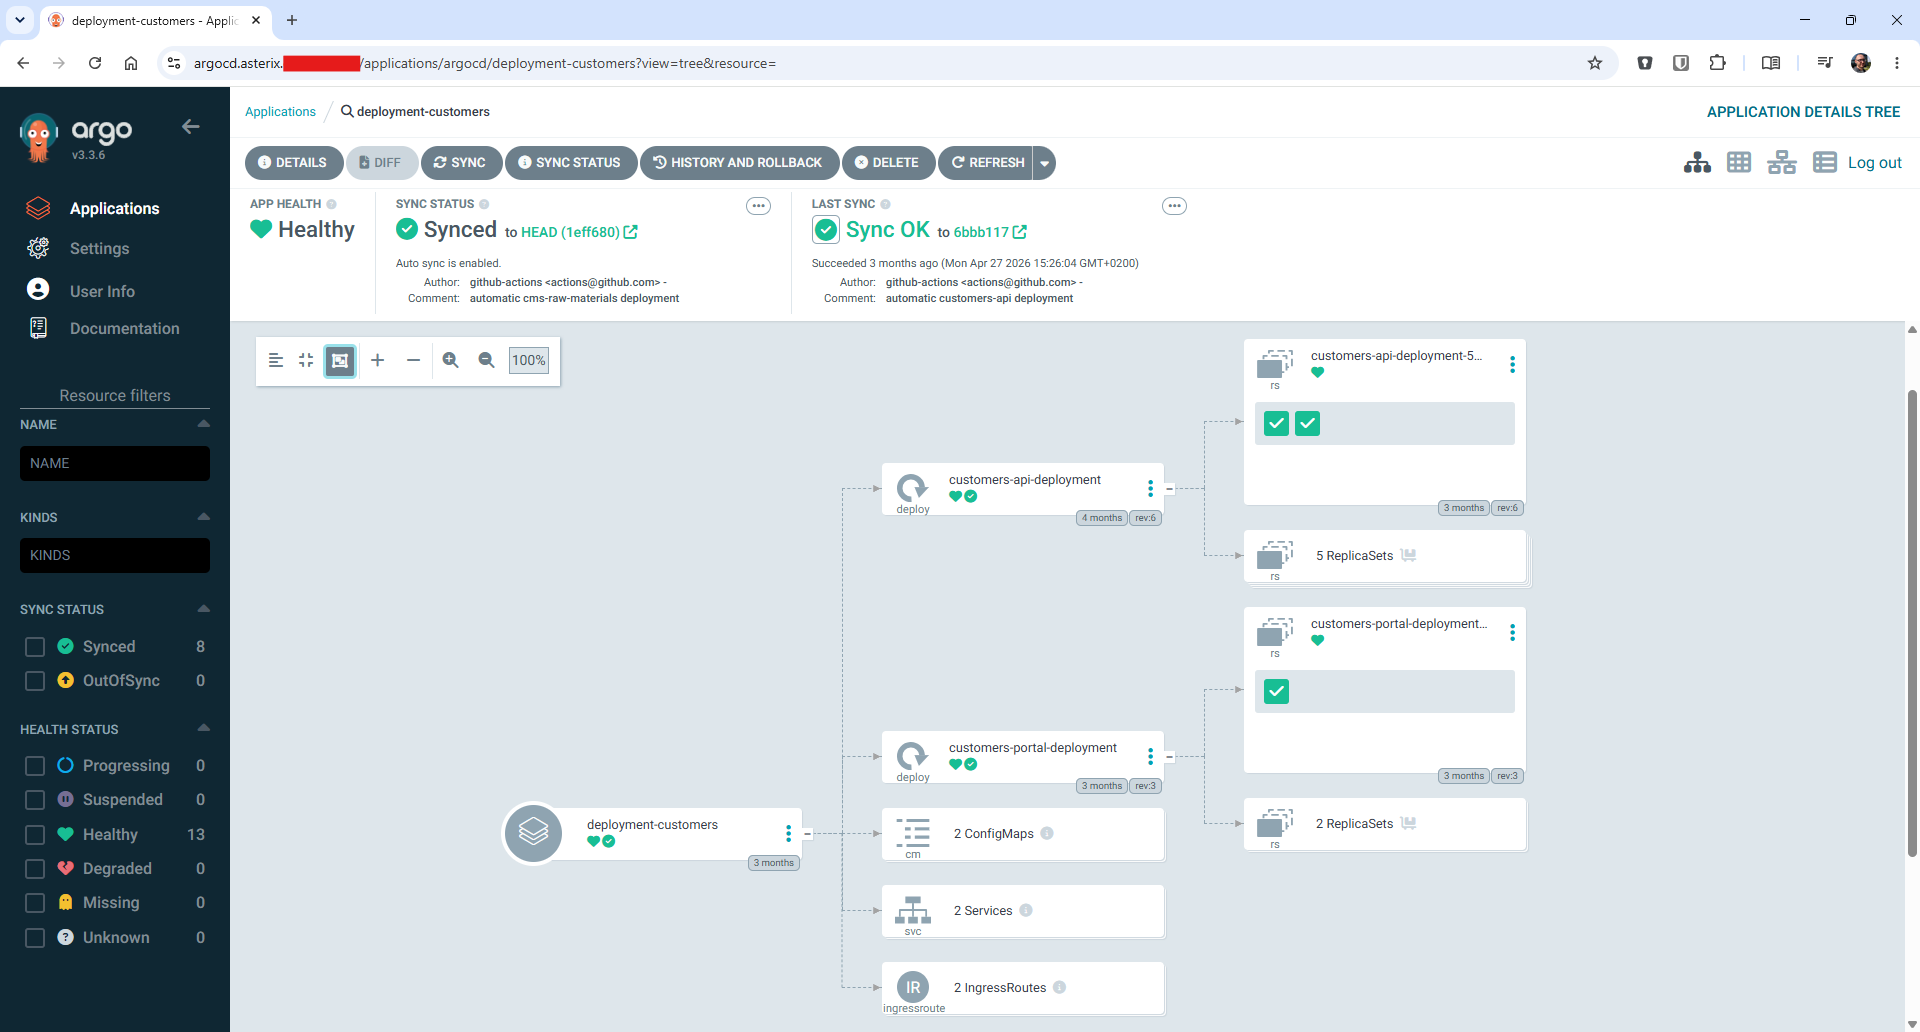
With Git as the source of truth, every production change remains visible, reviewable, and traceable from the application commit to the running workload.
Operating the platform
For day-to-day visibility, we use K9s to inspect the live state of a cluster without leaving the terminal. It provides a fast view of namespaces, workloads, services, ports, and platform components, making it useful when investigating an issue or confirming the state of a release.
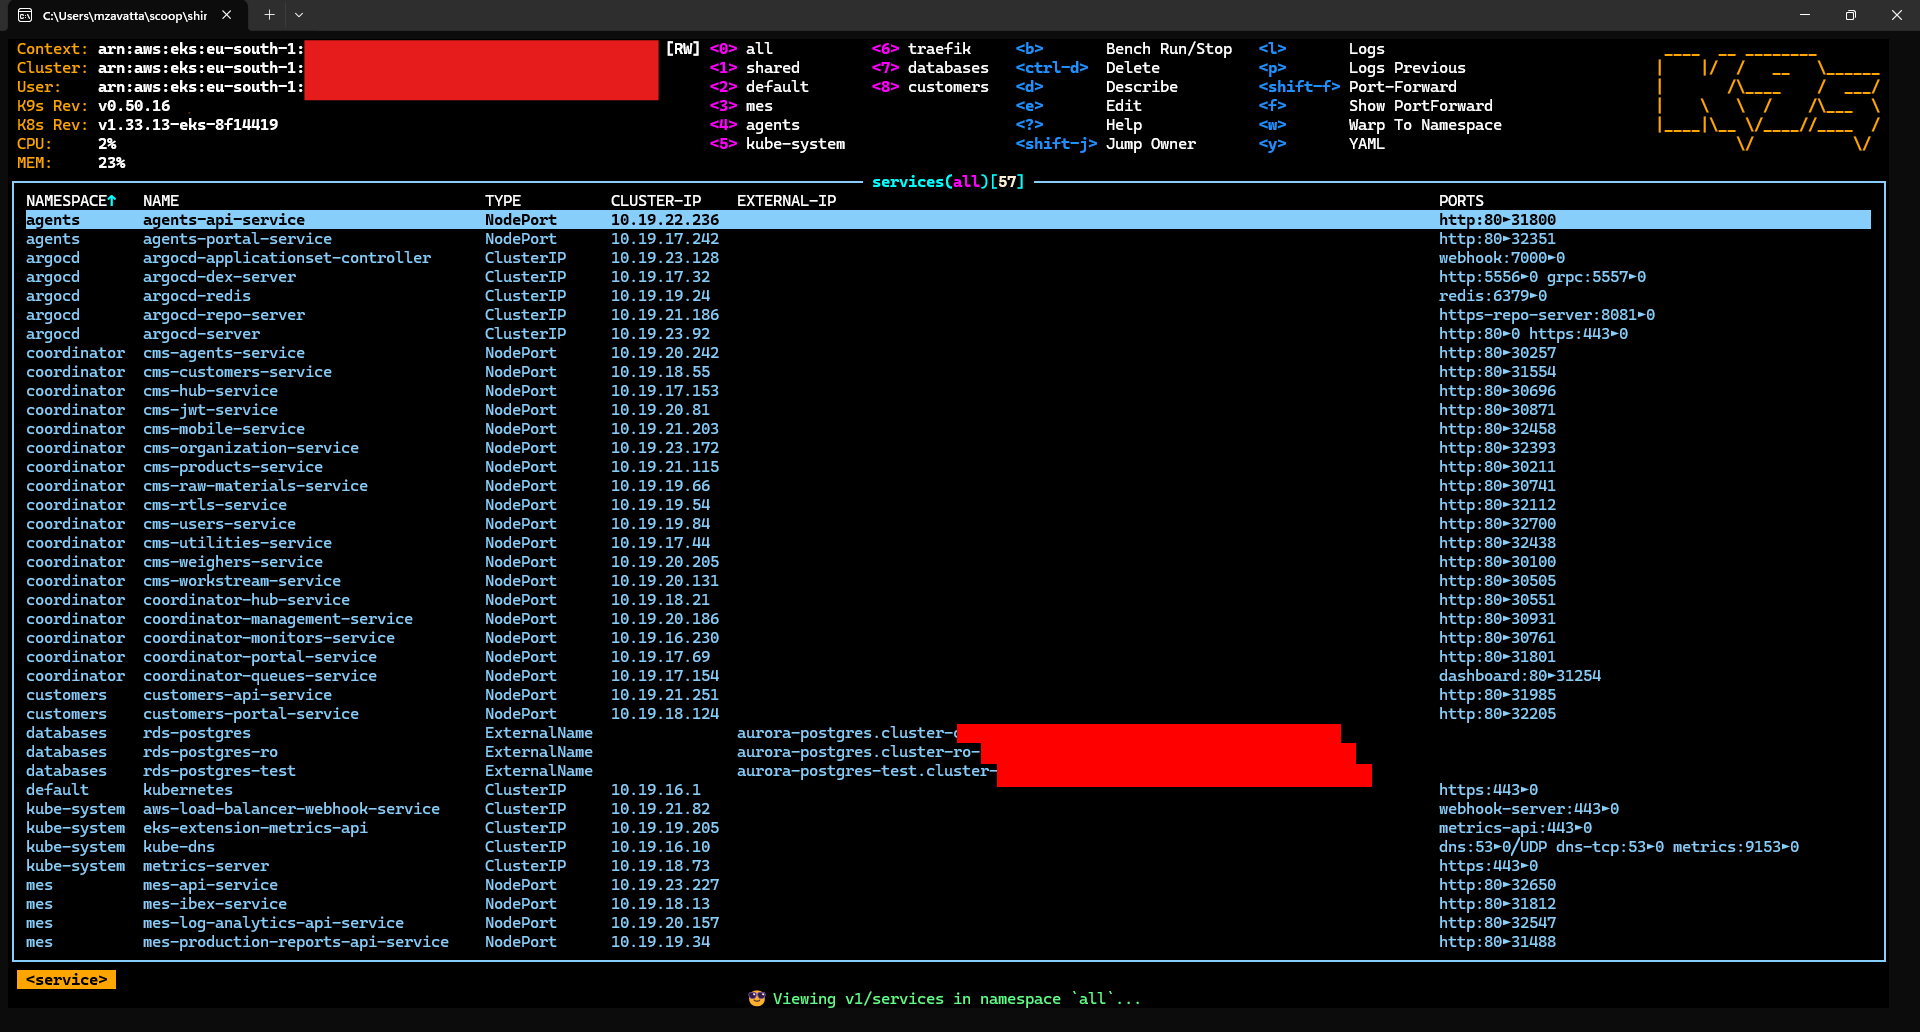
K9s is also useful for small, disposable interventions: temporarily scaling a service, opening a CLI inside a workload, inspecting logs and errors, or running direct checks against a service. These actions are intentionally treated as short-lived operational tools rather than the way the platform is configured.
Observability is centralized across Prometheus, Grafana, and CloudWatch, giving the team a shared view of application, Kubernetes, and AWS signals. Once a manual change has proved necessary and should persist, it is moved back into the repository and reconciled through Argo CD, preserving Git as the source of truth.
Operational work follows a simple loop: observe the platform, investigate a symptom with the appropriate tool, apply a temporary mitigation when necessary, and then move the durable fix back into Git. This preserves the speed needed during an incident without compromising the declarative model of the platform.
What I would improve next
The current design provides a practical balance of availability, operational control, and delivery speed. The next improvements I would explore are:
- Separate VPCs for the two clusters. Moving the clusters into dedicated VPCs would increase network isolation and reduce the scope of a VPC-level failure.
- Progressive delivery for selected releases. Canary or traffic-shifting strategies would allow a new application version to be validated against a limited share of traffic before a broader rollout.
- More controlled cutover automation. The existing CLI could evolve with pre-flight checks, validation gates, and an explicit approval step before a DNS change.
- An on-premises disaster-recovery path. A temporary backup cluster in the company data center could provide an alternative if AWS became unavailable. Internal DNS could then direct traffic to a local IP through the existing site-to-site VPNs, without relying on AWS as a transit point.
Conclusion
This project gave me the opportunity to build a detailed, practical understanding of Kubernetes and EKS, supported by focused study and by direct conversations with experienced practitioners who helped guide the most critical decisions. It was a close, hands-on collaboration rather than a traditional outsourced engagement, and that direct involvement made the outcome far more valuable.
Feel free to get in touch if you are working through a similar platform challenge, want to exchange ideas about Kubernetes and GitOps, or simply have a question about the approach described here.